
Operational leaders are managing increasingly complex operations with a partial and sometimes distorted picture of reality.
On paper, performance often appears acceptable. Productivity looks reasonable and service levels are broadly being achieved.
Spend time with frontline teams, however, and a different picture emerges. Work waits in queues, tasks are reworked, people are interrupted and issues are handed between teams. Workarounds become normal practice, while experienced team members spend much of their day firefighting and teaching others how to navigate through.
Over time, these losses become accepted as part of normal work. Organisations become highly effective at managing around problems rather than eliminating them.
Performance appears normal and acceptable, but only because the operation has adapted to accept losses as part of the work.
The opportunities can be substantial, at a time when leaders are under growing pressure to reduce costs, improve customer outcomes, deploy technology successfully and do more with the resources they already have.
Reducing the Time to Open a Business Transaction Account | Big-4 AU Bank
Our client was seeking to compress opening times for business transaction accounts to improve customer experience.
Despite seeking help from two external consultancies using specialist data skills and process mining tools, they were unable to accurately measure the time to open an account. The information required to understand performance was simply not captured by core systems.
Using Cinc Performance Insights, which was approved for use within 48 hours, we were able to quickly measure end-to-end performance and demonstrate the key issues were queues between process steps and a high rate of pended work at the initial step (i.e. low first touch completion rates):

A pilot tested improvements in 3 areas of focus:
1. Up-skilling of frontline leaders:
Formal training explained how a 'SLA mentality' was driving queues and sub-optimal customer outcomes. This was complemented by a claims simulation to teach the principles of flow, line balancing and root cause problem solving
2. Productivity improvements:
Changes to process to eliminate unnecessary work, plus revised productivity metrics to more accurately measure true productivity and reduce 'pacing'
3. Addressing the root causes of major pend reasons:
Cinc Performance Insights data not only tracked the occurrence of pends, but also the drivers. This information was used to isolate and address the major root causes that could be dealt with within the pilot timeframe
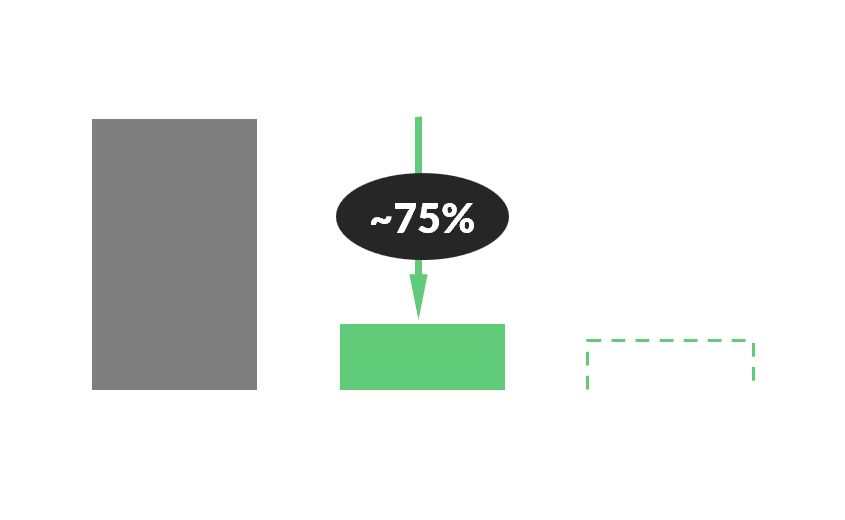
Reduction in average Business Transaction Account opening time:
System Performance Cannot Be Improved By Optimising Individual Activities Alone
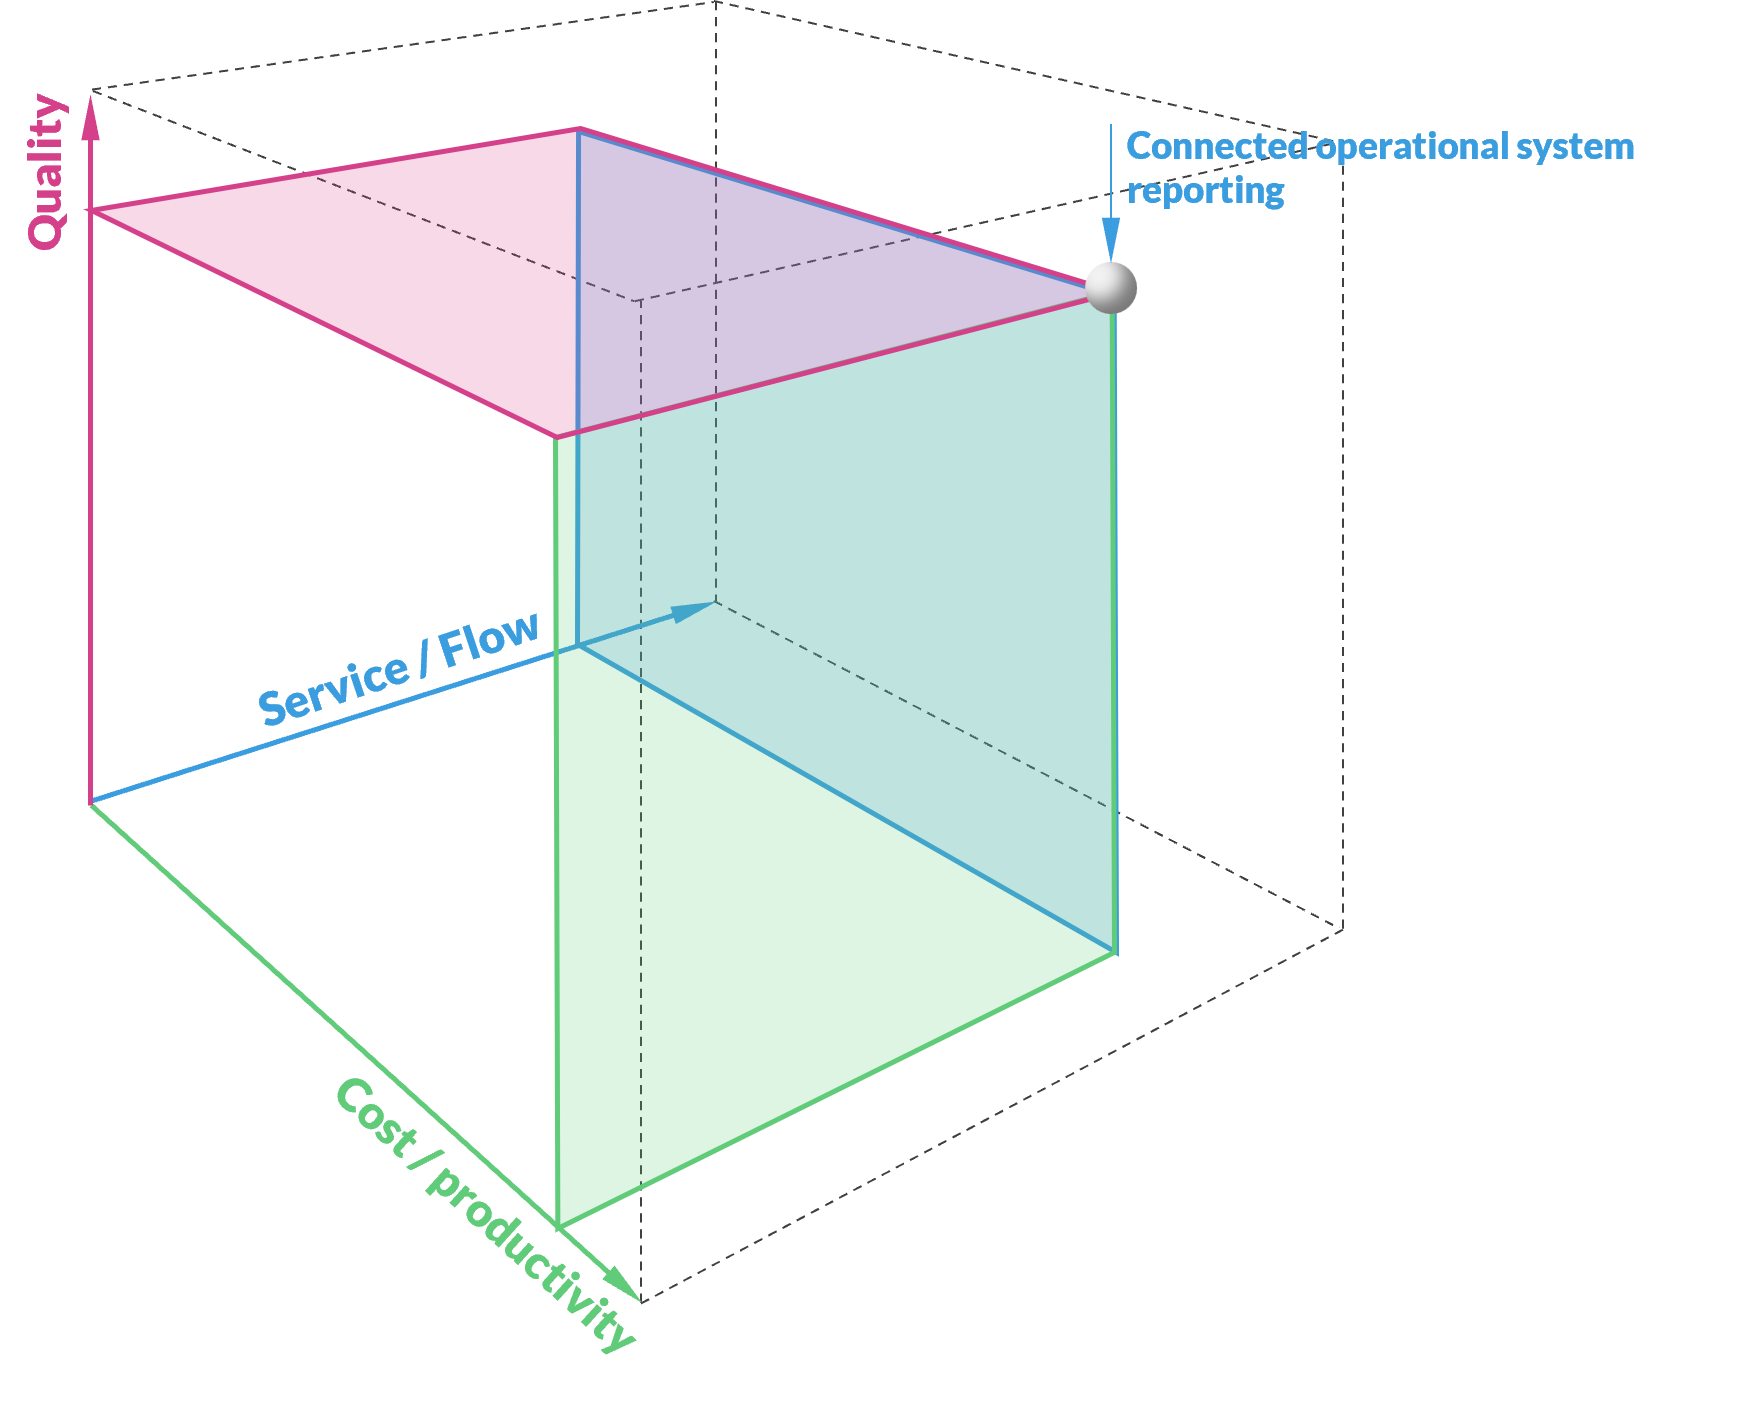
Most organisations measure productivity, quality, service, backlog, capacity and cost separately, even though operational performance is created by the interaction between them.
Poor quality creates rework. Rework consumes capacity. Reduced capacity creates delays. Delays increase backlog. Backlogs affect service, and service failures generate additional work.
Without understanding these relationships, scarce improvement effort and investment can be directed towards visible symptoms rather than the constraints limiting system performance.
Operational performance is a function of the interaction between people, work, quality, service, flow, capability and capacity. It needs to be understood as a system.
Across industries and operating environments, we found ourselves solving remarkably similar problems.
The information required to understand performance was frequently fragmented, difficult to access or not captured at all. Organisations responded with dashboards, trackers, analyst teams, consulting projects and process mining initiatives.
We did the same, building practical reporting and data capture solutions to support improvement. They worked locally, but rarely scaled.
The team next door often faced the same management questions but used different processes, systems and measures. Each team therefore needed its own combination of system reporting, integration and additional data capture.
Previous solutions provided a starting point, but quickly evolved into separate instances tailored to local requirements. This created more maintenance, more complexity and more disconnected data.
Local visibility improved. System visibility often did not.
Over time, three patterns became impossible to ignore:
While systems, data sources and reporting environments varied significantly, the management questions rarely did.
Leaders consistently needed to understand productivity, cost, service, capacity and improvement priorities.
Operational environments looked very different on the surface, but to a trained eye many were variations of the same underlying dynamics.
Over time, we distilled our requirements down to a relatively small set of operational information capable of explaining the majority of performance outcomes.
Once we knew what information mattered, we no longer needed a different solution for every team. We could standardise the underlying requirements while configuring the solution to suit different teams, processes and operating environments.
Even the simplest operations contain important information that is not consistently available from core systems. It may sit across multiple systems, be embedded in manual processes or not be captured at all.
The task was to capture the right information consistently and connect it across the broader system.
Standardising those requirements made a scalable solution possible. The remaining design challenge was supporting different work types, process families and operating models while preserving a common, connected data structure.
What organisations needed was not another spreadsheet, tracker or reporting layer. They needed a scalable foundation that could make operational reality visible, connect performance across the system and help leaders act on what they found.
This knowledge became foundation for Cinc Performance Insights (CPI).
CPI is a management system for operational performance improvement built on four integrated elements:
CPI captures the operational information required to understand performance, including information missing from core systems.
Where reliable information already exists, CPI can use it (e.g. via APIs) and manual capture can be streamlined (or eliminated where the data set is complete) for those teams.
Carefully designed configuration options enable a team to record data for everything from 'widgets' to case management to projects, all within an easy-to-use interface. Shortcut features make logging as efficient as possible, minimising capture effort while maintaining data quality.
CPI connects people, work, quality, service, flow, capability and capacity to build a systems view of operational performance.
Decades of operational improvement expertise are embedded in the data and calculation model covering measurement, work and loss classification, productivity, quality, flow, capability development and problem-solving.
The model contains the structure and logic required to accommodate different work types, process families and operating dynamics within a common framework.
CPI transforms operational data into dashboards, visualisations and system views that make operational reality visible, highlighting variation, loss and abnormalities in real time.
Leaders can understand how value is created and where capacity is lost across teams, processes and functions, explore the relationships between demand, capacity, productivity, quality and service, and identify where their improvement efforts will have the greatest impact.
The system is designed to be robust against 'gaming' and for precise and continuous calibration - no more relying on periodic time-and-motion studies and dealing with wide variations in standards between teams.
Rather than reporting isolated metrics, CPI helps leaders understand performance as a connected system. The platform supports structured problem solving by helping leaders identify and prioritise problems, investigate causes and assess the impact of countermeasures.
Technology alone does not improve performance. Better information only creates value when leaders can interpret it, act on it and use it to develop their teams.
CPI gives leaders unprecedented visibility into operational performance, but seeing opportunities is only the beginning. Leaders must also know how to respond.
The platform is supported by an integrated leadership development curriculum combining formal training, coaching, on-the-job learning and structured improvement activities. Leaders use CPI to identify opportunities, investigate causes, implement countermeasures and measure results.
Rather than separating learning from operational performance, leaders use CPI to solve real business problems, building capability while delivering measurable improvements in productivity, quality, service and capacity. Teams learn to view problems as opportunities for learning and improvement, creating a positive culture where issues are surfaced, understood and solved as part of daily work rather than hidden or worked around.
The result is stronger leaders and teams, better processes, and measurable improvements in operational performance.
Understanding the impact of pends on cost and service | Big-4 AU Bank
People work most efficiently and effectively whene they can pick up a unit of work and complete it in 'one touch'. When this is not possible, e.g. because they need addtional information from the customer, we say the work is 'pended'. Typically, the person doing the work will retain ownership of that item, so high pend rates result in each individual accumulating 'portfolio work-in-progress'. This WIP is a queue delay for the customer, but the work fragmentation and coordination effort also has negative impacts on productivity and increases performance variation. The impact of this process 'friction' is rarely quantified, so people often underestimate both its magnitude and its impact on overall system performance.
The example below is a redacted view from CPI's End-to-End Dashboard module for a complex process in a large Australian bank. This particular view highlights the impact of pends on productivity and service performance:
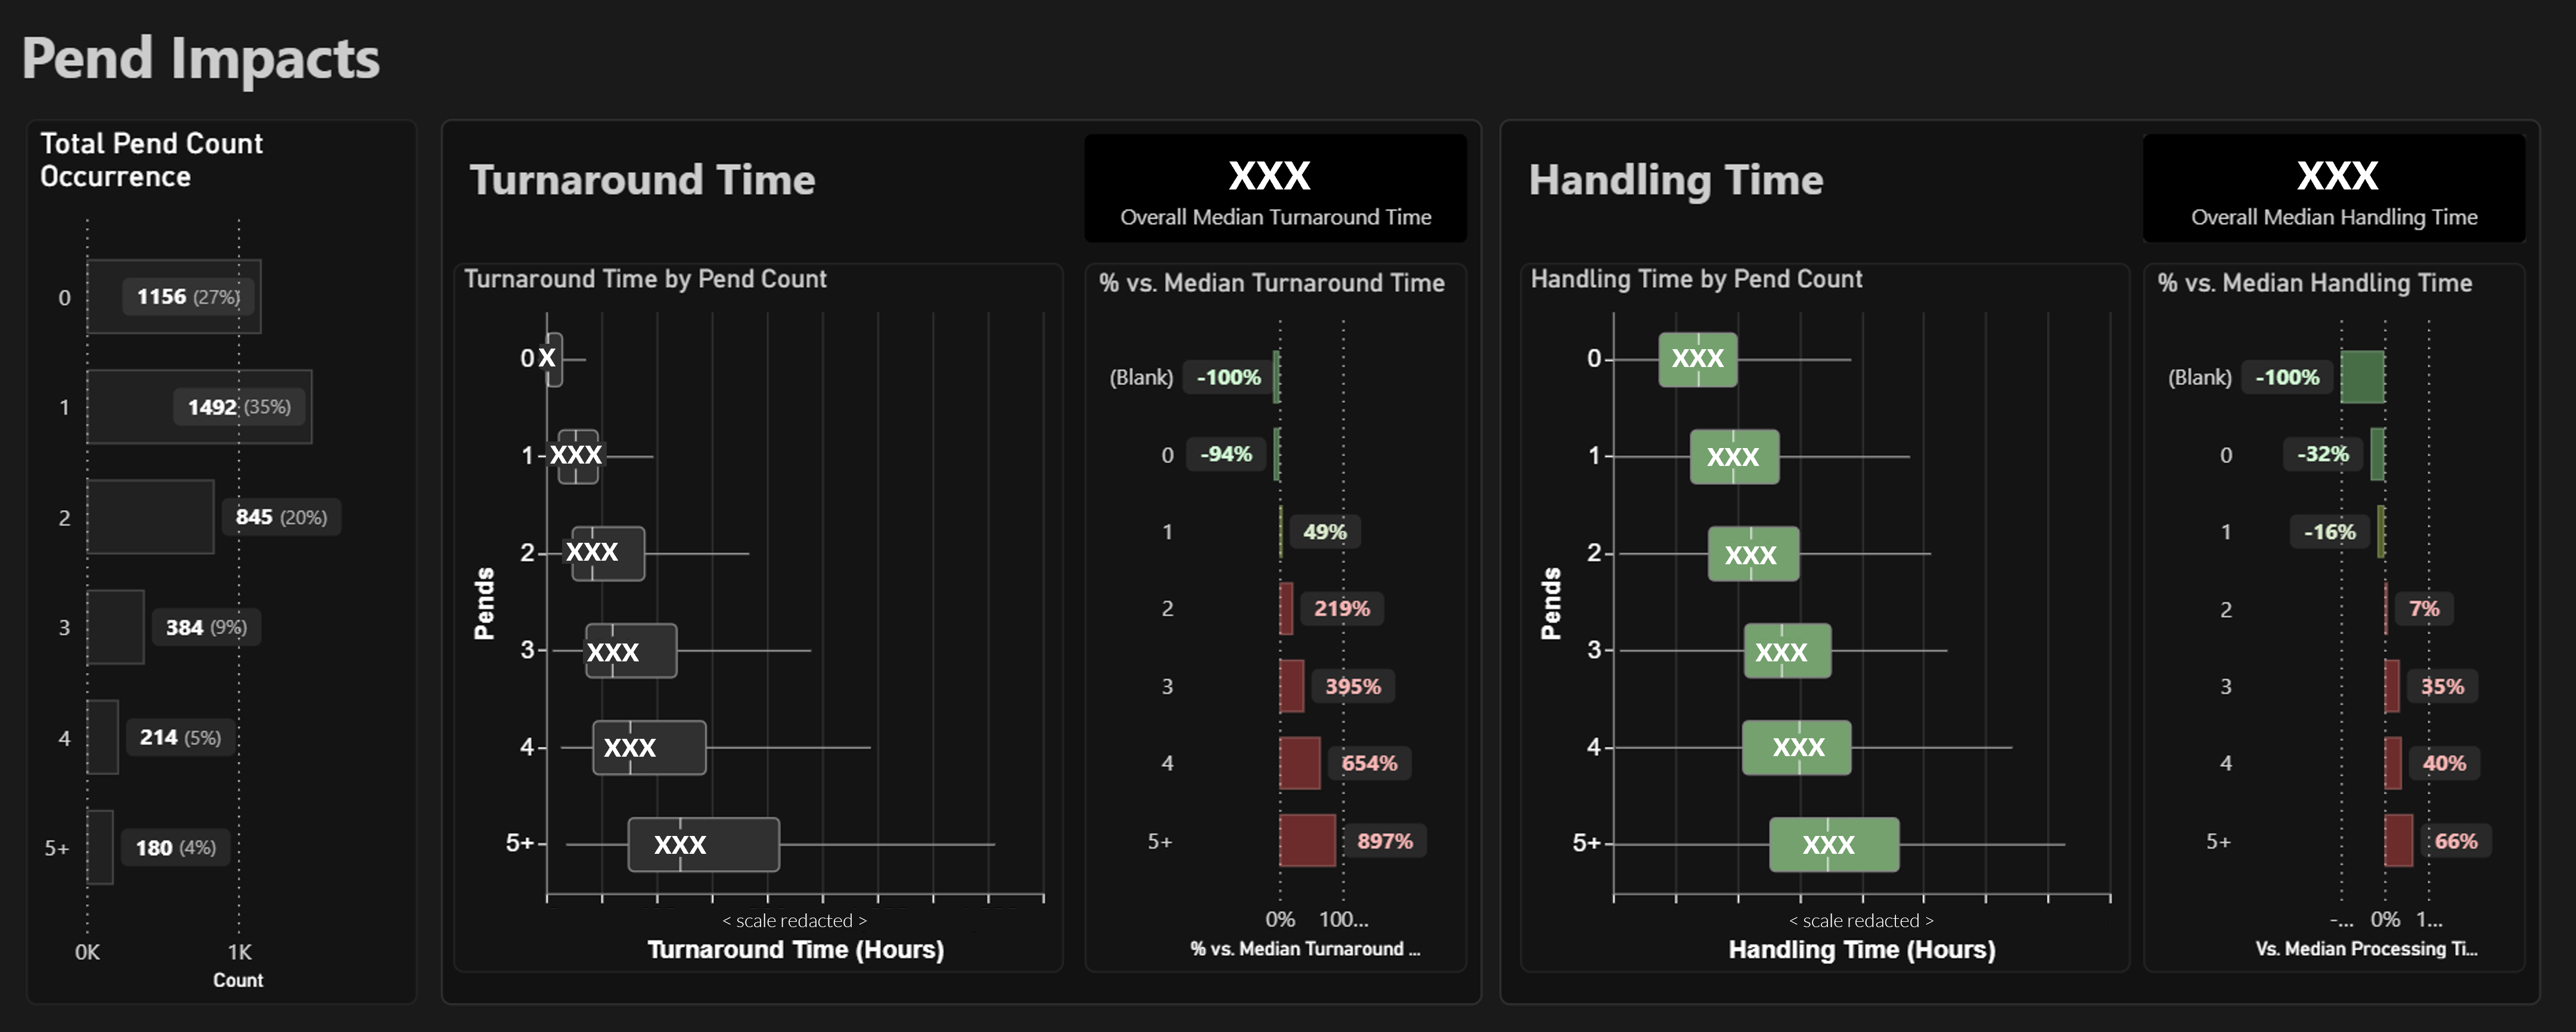
Only 27% of work flowed through the process without a pend. As pends increase, both effort and customer waiting time increase dramatically. Compared to work completed without a pend, work with two pends requires 62% more handling effort and takes over 12 times longer to complete. Understanding why work is being pended is therefore critical to improving both cost and service. CPI captures the reasons behind each pend and connects them to broader operational outcomes, enabling root cause analysis and targeted improvement.
Improve Operational Performance
Identify constraints, focus improvement effort and measure the impact of change.
Develop People and Leadership Capability
Support coaching, ownership, structured problem solving and continuous improvement.
Realise More Value from Shared Services, Outsourcing and Offshoring
Create connected visibility across service delivery models, teams and locations to expose performance gaps and realise more of the expected benefits.
Prioritise Technology and AI Investments
Identify where technology can have the greatest operational impact and direct investment towards the opportunities that matter most.
Realise More Value From Technology and AI
Understand how work, capacity, quality and service have changed, and actively measure and harvest benefits.
Strengthen Workforce Planning
Connect operational management with operational planning through better visibility of demand, capacity, productivity, flow and performance.
Request a demonstration (via 'GET IN TOUCH') below.
Cinc Performance Insights (CPI) is an operational performance management system that helps organisations understand how work is performed, how work flows, and where quality, service, capacity and cost are being affected.
It combines an intuitive and efficient user interface, a purpose-built operational data model, management visualisations, a structured operating rhythm and leadership capability development into a single operational performance management system that helps organisations improve performance and sustain results.
No.
CPI is designed to understand and improve the operating system, not monitor employees for its own sake. It helps leaders identify where performance is being affected by rework, delays, interruptions, workflow constraints, unclear priorities and other sources of operational loss.
The objective is to make problems visible, improve the way work is performed and create better operational outcomes for customers, employees and the organisation.
No.
CPI helps leaders identify where support is needed and, just as importantly, where it is not. When work is flowing normally and performance is stable, leaders can confidently leave people and teams alone and focus their attention elsewhere.
When issues do emerge, CPI helps make them visible earlier so leaders can remove obstacles, provide support and resolve problems before they affect customers, employees or business performance. The longer the elapsed time between occurrence, detection and response, the greater the operational impact is likely to be.
Earlier visibility also increases the likelihood that leaders can observe the problem while it is still occurring, making it easier to understand the underlying causes and respond appropriately rather than relying on hindsight or assumptions.
The same visibility also helps leaders recognise strong performance, learn from high-performing teams and share better ways of working across the organisation.
Most people want to do a good job. The objective is not greater supervision. It is to make problems visible, respond with appropriate support and make it easier for people and teams to succeed.
No.
CPI is designed around operational information such as work types, activities, time stamps, outcomes, delays, pend and rework reasons and sources of operational loss rather than customer content or sensitive personal information.
The information collected is agreed during implementation and aligned with each organisation's requirements. Free-text fields are typically not used, reducing the risk of capturing sensitive customer or employee information unnecessarily. In many environments, the operational insights required can be generated without recording sensitive customer information.
Client data is stored within dedicated Australian-hosted infrastructure for each client, ensuring data remains isolated and is not shared between organisations. This approach often simplifies security, privacy and risk reviews. In one large Australian banking environment, the proposed capture approach was reviewed and approved for use within 48 hours.
Most organisations already have dashboards, reports and operational systems. The challenge is that the information required to understand performance is often spread across multiple platforms, spreadsheets, trackers and local databases.
CPI brings these disconnected data sources together into a single operational view, connecting productivity, workflow, quality, capacity, service and cost in one place. This allows leaders to understand how these dimensions interact and where constraints, losses and improvement opportunities exist within the system.
In many environments, CPI also replaces a significant number of Excel trackers, SharePoint lists and manual reporting solutions that have evolved to fill gaps between existing systems.
Some teams may operate with fully automated data ingestion from workflow, CRM or case management platforms. Others may rely on manual data capture because the information simply does not exist elsewhere. CPI allows both approaches to exist within a common operational model, ensuring performance is measured consistently across the operation regardless of how the data is collected.
Rather than creating another dashboard, CPI is designed to become the operational performance management layer that sits across the operation. It brings information together, provides a consistent method of measurement and gives leaders a connected view of how the operation is performing.
The goal is not simply to report performance. It is to help organisations improve it.
There is some effort involved in capturing operational data, but in many environments CPI removes or significantly reduces existing Excel trackers, SharePoint lists, manual reports and locally maintained databases that teams are already using to manage performance.
The net impact is often far smaller than leaders initially expect and will often result in an overall time saving.
The data capture interface is configured to match the work being performed. Simple, high-volume activities can be logged in batches and take only seconds. More complex work that takes hours or days can justify additional information such as work attributes, pend reasons, rework drivers and other factors that help explain performance.
We also measure logging effort. If capture is taking more than around ten minutes per person per day, we review what is being collected, remove lower-value fields and simplify the process. The objective is to collect enough information to generate meaningful operational insight, not create administrative burden.
The interface includes shortcuts, personalised task lists and quick access to frequently used activities, paused work and pended items to minimise effort wherever possible.
Most importantly, the value of the information must exceed the effort required to collect it. When organisations begin quantifying rework, delays, hidden demand, workflow constraints and capacity loss that were previously invisible, the return on that investment is often substantial.
CPI is designed to make it difficult to materially distort results without creating obvious inconsistencies.
For example, work is typically logged against unique work item identifiers, reducing the risk of, and ability to, count the same work item multiple times.
Time is also captured in real time, meaning every minute ultimately ends up somewhere in the operational model. If time is incorrectly recorded against productive activities it will typically appear as lower productivity and longer handling times. If it is recorded elsewhere, the impact becomes visible in utilisation or other operational measures.
In practice, the more common challenge is logging accuracy rather than deliberate manipulation. CPI is designed so unusual patterns and inconsistencies tend to appear as abnormalities in the data, prompting management enquiry and review.
Our experience is that good logging discipline can be established quickly. Once people understand the purpose of the information being collected and how it is used, data quality is typically very high and remains sustainable over time.
The objective is not to catch people out. It is to create a reliable operational picture that helps leaders make better decisions, identify improvement opportunities and provide support where it is needed.
No, but one of the first benefits many organisations see is the elimination of dozens of Excel trackers, SharePoint lists, manual reports and locally maintained performance databases that have evolved over time to fill gaps in existing systems.
CPI is designed to become the operational performance management layer, creating a single source of truth for productivity, workflow, quality, capacity and cost.
It does not typically replace systems of work such as workflow, case management, CRM, or ERP platforms. Instead, CPI can leverage data from those systems through integrations, APIs and other data connections while also capturing information that those systems do not currently record.
The result is a more complete operational view without disrupting existing operations.
CPI is designed to deliver useful operational insight quickly.
The platform can typically be configured and in use within days, allowing teams to begin capturing operational data and generating initial insights almost immediately.
As sample sizes accumulate, the operational model becomes progressively more robust, with meaningful baselines and performance insights typically emerging within one to three weeks.
Unlike traditional workforce planning and productivity methodologies, CPI does not require lengthy time-and-motion studies before useful information becomes available. Actual handling times and operational data captured through normal work activities provide a practical foundation for understanding performance and refining operational standards over time.
Many workforce planning approaches rely heavily on assumptions about future productivity, capacity and workforce requirements. CPI is grounded in actual operational performance and continuously validates planning assumptions against what is happening in the operation.
CPI also helps organisations identify sources of operational loss and model the impact of planned improvements. This allows future workforce plans to reflect anticipated performance improvements rather than simply resourcing to historical performance levels. Without this visibility, productivity gains are often lost through pacing because the workforce continues to be planned around yesterday's performance.
CPI supports both long-term workforce planning (helping organisations right-size and right-skill teams to accommodate forecast changes in demand and work mix) and short-term capacity balancing.
A unique feature is the workforce marketplace. Teams with surplus capacity at a particular point in time can proactively flag a willingness to make that capacity available to other teams, while teams experiencing a shortfall can identify relevant skill pools with available capacity and request support.
This helps match capacity with demand more quickly and can make capacity-balancing meetings significantly more efficient, as much of the information gathering and resource matching has already occurred beforehand.
Those meetings may still occur, but they become more focused and productive. Instead of spending time determining where capacity exists, leaders can focus on decisions that genuinely require judgement, such as prioritisation, service trade-offs and longer-term workforce strategies.
The result is a workforce planning approach that is better calibrated, less dependent on assumptions and more closely aligned to how work is actually performed.
Many organisations struggle to quantify the benefits delivered by technology investments because they lack a clear operational baseline.
CPI helps establish that baseline before change is made and measures performance afterwards. This allows organisations to identify where automation, AI and technology are most likely to create value, prioritise competing initiatives and verify whether expected benefits were actually achieved.
It also helps quantify released capacity and supports decisions about whether that capacity should be removed, redeployed or redirected to higher-value work.
No.
Technology alone rarely improves performance. Better information only creates value when leaders can interpret it, act on it and use it to improve the way work is performed.
CPI combines software, management systems and leadership capability development to help organisations expose problems, improve processes, develop teams and sustain results over time.
The objective is not simply to provide better reporting. It is to help leaders create better operational outcomes.