Leaders are managing with a partial picture.
On paper, performance often looks acceptable. Spend time with frontline teams and a different picture emerges: work waits in queues, tasks can’t be finished in one touch, workarounds become normal and experienced people spend their days firefighting. CincPI grew out of years of seeing the same pattern, and the same barriers to fixing it.
Three barriers kept getting in the way.
Seeing operational reality.
The signal of loss is strongest closest to the work, and it is diluted twice on the way up. First by measurement: allowances for friction get built into standards, so measures describe the accepted process, waste included. Then by reporting: averaging and aggregation bury loss and hide variation. The reports aren’t wrong. They’re just flattering.
Understanding performance as a system.
Most organisations measure productivity, quality, service, backlog, capacity and cost separately. But poor quality creates rework, rework consumes capacity, lower capacity grows backlogs, and backlogs degrade service and generate more work. Optimise the parts in isolation and investment chases symptoms, not causes.
Creating connected visibility at scale.
The information leaders needed was distorted, fragmented or not captured at all, so gaps were filled with spreadsheets, SharePoint trackers, analyst teams and process mining. Our own pilots built local solutions that worked but didn’t connect, scale or roll up. And extracting core system data falls short when every team runs different systems and key data was never recorded.
Across industries, three patterns became impossible to ignore.
The management questions were consistent.
Systems and data sources varied enormously. The questions didn’t. Leaders needed to understand productivity, cost, service, capacity and where to focus improvement.
So was the information needed to answer them.
Operations that looked very different were variations of the same underlying dynamics. We distilled a small set of operational information that explains most performance outcomes, so we could standardise the requirements and configure for each team.
Extra data capture was almost always required.
Even simple operations hold critical information that core systems don’t record, or that sits across several systems. The task was to capture it consistently and connect it across the wider system.
“What organisations needed was not another spreadsheet, tracker or reporting layer. They needed a scalable foundation that makes operational reality visible, connects performance across the system and helps leaders act on what they find.”
That became the foundation for Cinc Performance Insights.
One pend changes everything downstream.
People work best when they can pick up an item and finish it in one touch. When they can’t, often because information is missing, the work is pended. The person usually keeps the item, so high pend rates build a personal portfolio of work in progress: a queue for the customer, and fragmented, slower work for the team.
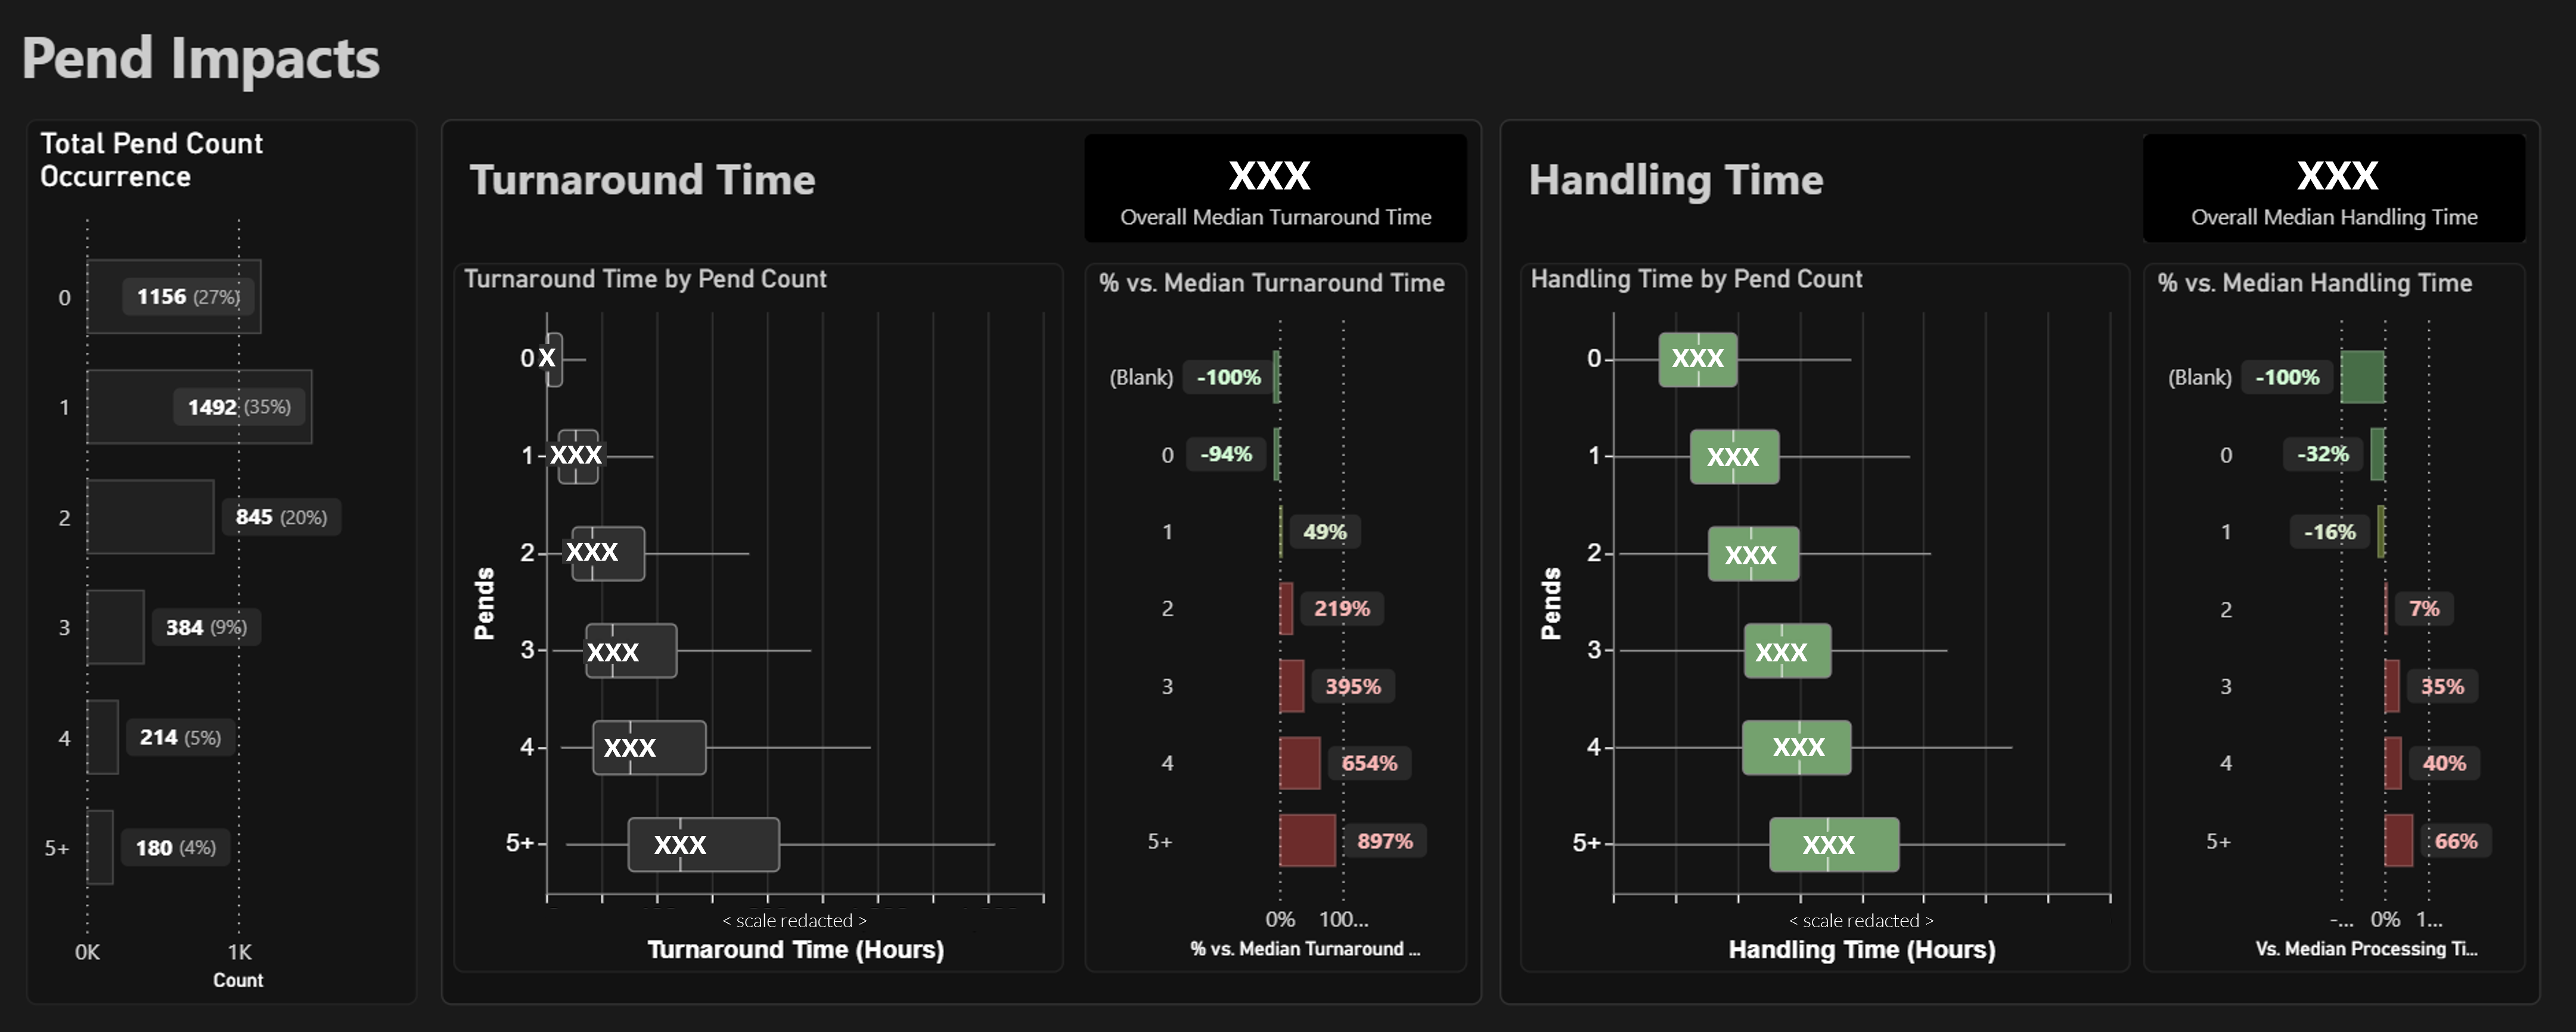
Redacted view from CincPI’s end-to-end module, complex process at a large Australian bank. Only 27% of work flowed through without a pend. Compared with work completed in one go, items pended twice needed 62% more handling effort and took over 12 times longer to complete. CincPI captures why each item was pended, so the causes can be found and fixed.
Why a connected model matters.
A single pend affects productivity, flow, waiting time, capacity and cost. Rework behaves the same way. Measure productivity without flow, or service without effort and capacity, and you only see part of the story. CincPI brings these dimensions into one operational data model, so leaders can see how they interact.
See it on your own operation.
Book a 30-minute session to see CincPI, and where loss may be hiding in your current measures.